What is Blockchain Technology ?

A blockchain is a digital ledger of transactions that is replicated and disseminated throughout the network of computer systems that make up the blockchain. Each block on the chain contains a number of transactions, and whenever a new transaction occurs on the blockchain, a record of it is added to each participant’s ledger.

Simply said, blockchain technology is a distributed, decentralised ledger that keeps track of the origins of digital assets. A blockchain’s data is immutable by design, making it a true disruptor in industries such as payments, cybersecurity, and healthcare.

A fundamental comparison for understanding blockchain technology is a Google Doc. Instead of being replicated or moved, when we create a document and share it with a group of people, it gets disseminated. This creates a decentralised distribution network in which everyone has access to the document at the same time.

A blockchain database is a one-of-a-kind database format. It saves data in a unique way as compared to a standard database. Blockchain saves data in blocks and then forms a chain by connecting the previous block to the current block.

As new information is received, it is added to a new block. After the block has been filled with data, it is chained onto the preceding block, forming a chronological chain of data. A blockchain may store a wide range of data, although the most popular application to far has been as a transaction ledger.

Blockchains such as Bitcoin and Ethereum are continually growing as new blocks are added to the chain, significantly enhancing the security of the ledger.

In the case of Bitcoin, blockchain is used in a decentralised way, which means that no single person or organisation has authority over the system; rather, all users have collective control.

Decentralized block-chains are immutable, which means that the information stored on them cannot be altered. This means that all Bitcoin transactions are permanently recorded and available to everyone, and no one can change them.
What is difference between XML and JSON ?

In Today’s Scenario, Aas we all know and aware about the JSON and XML. JSON is used to transfer data from one language to another language. Generally in JSON we receive data from a web server and transfer it to a web page and this language is workable with JavaScript. We can say in simple language that JSON is a data-interchange format, which transmitting data in web application. We can use JSON with any programing language.

We have two methods available in JSON object-

  1. When a string object converts into a JSON format that means Serialization.
  2. When JSON format converts into string object is known as Deserialization.

If we are using JSON so the size of the file is smaller due to this it transfers the data faster.

XML is a set of rules that encodes data in a human-readable and machine-readable format. XML is a language that exchanges data and gives data security and validation. We can take the example of banking services, e-commerce stores etc. XML data represented in tags format i.e. start tags and end tags.

XML gives a clear structure to data and create interactive web pages; in stored data inside tags in more accurate we search results.

Through we can exchange data quickly between different platforms.

Conclusion:

We can say both json and XML are ways to organize our data in an understandable format to numerous programming languages and API’s. XML is older than JSON, but at present JSON has gained momentum among its users due to javascript boom. Both JSON and XML serve same but it depends upon developer’s needs what they want to choose that suits the specific needs. Last but not least, the way data is store in XML also differs from JSON. While XML store data in a tree structure, contrarily, json stores is like a map, which entails key-value paires.

What is Database and how it makes the life easier ?

Since the 1960s, databases had come in the trend and were become popular in two different types. The first one is Navigational Database (Hierarchical Database) and the second one is the network database. Navigational Database depends upon the tree-like model which allowed a one-to-many connection while the Network Database allowed multiple relations, were used to transits the data. Even these ways were not so flexible and seamless. Relational databases gained popularity in the 1980s after that Object-oriented databases had opened the umbrella and get popular in the 1990s. Today we have almost reached the milestone of 5G, the faster speed and processing of unstructured data are vitally important to complete the scenario. When it comes to the collection, storage, management, and use of data, cloud databases and self-driving databases are forging new ground today.

Data is a collection of a small distinct unit of information. Data can be facts related to any object. For example, name, age, height, weight, etc. are some data related to a person.

A database is an organized collection of data. Database support electronic storage and manipulation of data. Databases make data management easy.

The main purpose of the database is to manage and operate a large amount of information by storing, retrieving, updating or deleting.

There are many databases available like SQL Server, MySQL, Sybase, Oracle, PostgreSQL, MongoDB, Informix, etc.

Why do we need database?

  1. It is easy to manage small amount of data in spread sheet. If we have millions of records, it became very difficult to find the record we need.
  2. We cannot validate data we are entering in spreadsheet.
  3. .Spreadsheets does not support multiple users to edit the data at same time in same sheet.
  4. Data redundancy is easily possible in spreadsheets.
  5. We cannot provide security to data in spread sheet. Anyone can access your data easily.
  6. Database support good data access. Database are searchable and sortable, so that you need can be found quick and easily.
  7. The simplest answer is we need databases because they organize data in a manner which allows us to query data, sort data, and manipulate data in various ways.

To prevent above mentioned problem associated with data handling in spread sheet database is required. Databases are managed by the database management system (DBMS).

DATABASE MANAGEMENT SYSTEM (DBMS) IDEAS

The following are some easy database project ideas. Choose one according to your requirements:

  1. E-commerce Platform
  2. Inventory Management
  3. Railway System
  4. College Data Management
  5. Library Data Management
  6. Solution for Saving Student Records
  7. Hospital Data Management
  8. Blood Donation Management
  9. Payroll Management Solution

Automatic Meter Reading and Analysis with UGO

Advancements in meter data capturing technology have taken decades and bounds over the last few years, meaning manual meter readings and estimated bills are becoming a thing of the past.

Here are the benefits of the Automatic Meter Reading device for Public Utilities

  • They capture accurate meter readings, so there are no more estimated bills
  • They are more secure and beneficial for Tamper detection
  • They increase profitability and reduce costs

Our innovative UGO – Utility on the GO is a cutting-edge product in data collection and analysis. It is an ERP for managing all billing-related actions; and also provides much more services like Revenue Collection, Tariff Management, Survey, Consumer data handling.

It is an energy meter reading system that helps to automate the process of measuring consumption in Electricity, Gas, and Water Utilities to assimilate data, procure the diagnostic and status of data quickly and accurately irrespective of source. It does not just work to calculate billing amounts but also offers troubleshooting and analytics based on fetched meter data.

The manual process to capture energy readings is time-consuming and utility expenses are being high. However, using the UGO (Utility on the GO) – an automatic meter reading and data collection system has enabled large infrastructures across India to collect energy meter readings with ease and helps to conduct an in-depth analysis of Meter Data.

Sources of Meter Data collection using UGO –

  1. Auto MRI with UGO Buddy Application
  2. Smart Meter Data through HES
  3. XML / MRD File Upload

Energy Meter Data can be captured through UGO Buddy App in a very easier way and can be synced to the server any time without any need of moving documents from one place to another; it has options to capture Meter status using Meter Image & various Remarks, Consumer info, Print Bill on the spot. UGO Buddy has a Location tracker which also helps in verifying consumer location.

Meter Data collection for consumers having a smart meter installed at their place is done by fetching Smart Meter’s data via HES (Head-End System) at a scheduled interval which require less human involvement.

Using the XML/MRD File Upload feature, bulk Meter Data can be uploaded to the UGO system in a very less time.

Meter Data Analysis with UGO BCS

Meter data captured through any of the above sources is displayed on specially designed UGO BCS. It groups all parsed parameters into different categories and also graphical representations are there for better comparison of data captured on a regular interval like Load survey, Maximum Demand, Daily Consumptions, etc. All data displayed on UGO BCS is also provided to download in MIOS XML format irrespective of the source.

Meter Data Analysis Summary report also generated by received meter data and displayed in UGO BCS that is provided to download or Print in PDF file. Including Summary Analysis, a Detailed Analysis report feature is also there like Reading reports, Process wise, LS Analysis, RTC Date Mismatch, and much more.

Conclusion :-

The next time you are asked to analyze Meter Data, take your time to ask how that reading has been obtained. If that is manual, there could be chances of human errors in data, but it’s an alert you need a significant opportunity to save your precious time as well as money.


The world is changing whether you like it or not. Get involved or get left behind.

D Dave Waters, Ex-Associate Professor (University of Oxford)”

What is Software Testing Life Cycle (STLC)

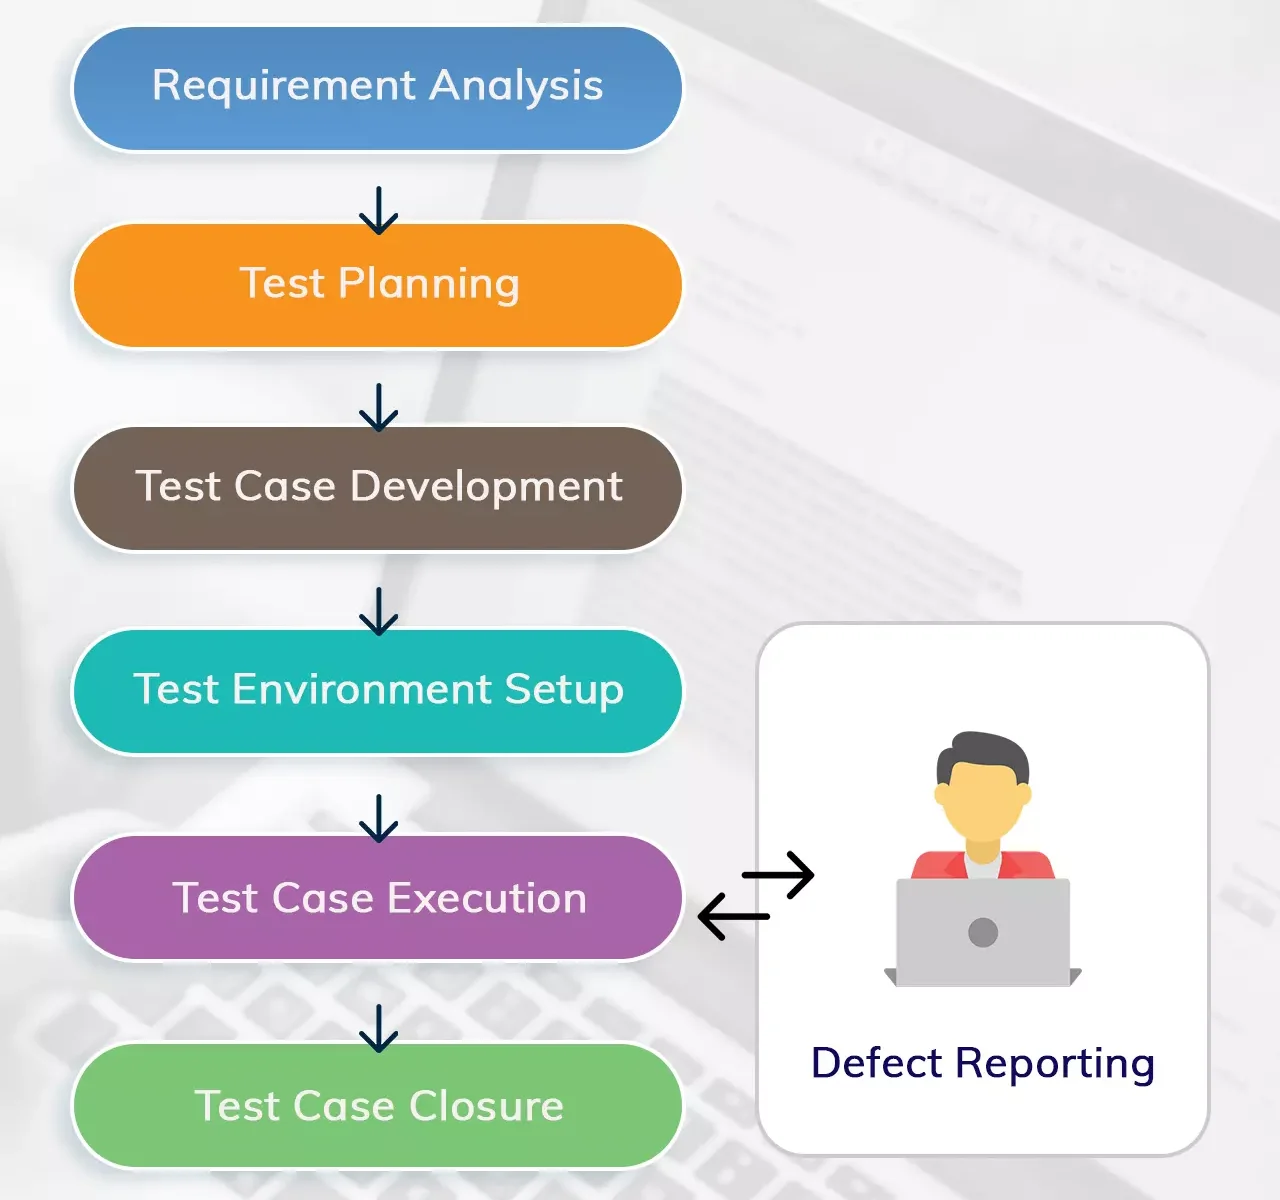
STLC stands for Software Testing Life Cycle, It’s the process of testing in a planned manner. In STLC various activities are carried out to make product robust. Let’s discuss various stages involved in Software Testing Life Cycle (STLC).

  • Requirement Analysis
  • Test Planning
  • Test Case Development
  • Test Environment Setup
  • Test case execution
  • Test Closure
  • Requirement Analysis

Requirement analysis is the very first step of Software Testing Life Cycle (STLC). In this step QA team study, all the requirements and if anything is not understandable then discuss with product owner or stakeholders for good understanding and requirement can be functional or non-functional.

Test Planning

In this stage of Software Testing Life Cycle (STLC) basically discuss what to test, how to test & who’s going to test. A test plan document is created at this stage, also calculate the estimated effort and cost for testing work. Test planning is started when requirement phase is completed.

Test Case Development

Test case development is started when test planning is finished. In this phase QA team write detailed test cases according to requirement, test cases cover almost every possible case and also prepare test data along with test cases if required. When test cases are complete then cases are reviewed by the lead.

Test Environment Setup

In test environment setup decides the software and hardware condition where product is tested, basically development team provides the test environment. In created environment test cases should be executed.QA team will prioritize the testing environment.

Test Case Execution

After the environment setup, now time has come to run the test cases. Using every test case, QA run each and every test case and compare actual and expected result and mark pass/fail or execute later and failed cases are reported sent to development team through bug tracking system or through excel and also bug is linked with related test case for better understanding. When bug is resolved by development team, then QA will execute again to retest the functionality.

Test Closure

This is the last phase of STLC where process of testing is analysed, all matrix, reports and result are documented like how many cases are pass and fail. Testing team verify that goals are achieved or not. Basically, in this phase test coverage, Quality, time, cost and also prepare test closure report. With all this team will learn and improve for their upcoming testing projects.

The difference between UI and UX ?

In this digital era of technology, we are all connected and aware of websites and applications. And for people who are directly or indirectly working in IT industry, UI and UX design are two of the most known words, also the most misunderstood words. Simply we always using UI/ UX Design in the pronunciation but are confused about the actual meaning of both because both are completely different.

Normally, we think that a UI designer is equivalent to a graphic designer. In the real world, UI (User Interface) have much a different and broad identity. The two different stages of a good product are design and development. Reaching the final stage of UI Design of a product is not an easy or simple task. A UI designer has to undergo and do a lot of tedious work to reach a perfect stage of product UI. The work involved in creating any product includes Analysis, Flowcharts, Feedback, Prototypes etc.

While choosing a website and app, consumers will prefer a product having powerful functionalities along with a better-looking design. A good interface attracts users while using the product. A good combination of Colour theme, Images, Font-family, screen layout, transitions, animations and every micro element must all be designed and placed well. When the appearance of the interface is able to exert a large impact on the user, means they enjoy the product and also, they likely use that product. Designers have the responsibility to collaborate all things in the finest way and create the look and feel of the user interface.

Only having a good UI is not enough. UX also matter to make a smooth journey while interacting with the product. The term “UX” stands for “user experience.” The way a user interacts with the app determines their overall impression of it. How the user interface elements created by UI Designer, will guide or navigate a user during interaction. Does the users can effectively complete their task easily or struggling with the elements. Experience and Interface both are participating equally so this is the main reason why UX designers are concerned about the User Interface. They are responsible to determine the structure of the interface and functionalities. In short, UX Designers design how the interface works. How the product will organize, navigate and operate to the user and how can relate an element with another one. If the experience is good and feels seamless, the user will have a good experience and surely will enjoy the product. But if navigation is complicated or confusing, then the lack of satisfaction is likely.

Creating a product with a seamless and smooth experience, it’s very important to do research on what users expect from the product. By organizing usability testing sessions where real users will go through the process and the functionalities to track that UI and UX Designer are on the proper path. Then it’s time to create low fidelity wireframe, after the consideration of all the iterations the high-fidelity mock-ups starts taking shape. When all the efforts are aligned in a proper way, the result will seamless and extraordinary.


No product is an island. A product is more than the product. It is a cohesive, integrated set of experiences. Think through all of the stages of a product or service – from initial intentions through final reflections, from first usage to help, service, and maintenance. Make them all work together seamlessly.

Don Norman, Inventor of the term “User Experience”

The digitalization of the Utilities Industry.

Technology is various stakeholders how businesses function, and therefore how electricity is generated, distributed, and monitored. The rise of utilities and the growth of Distributed Energy Resources are the precise hallmarks of a changing industry.

Green and renewable energy is rising in popularity.

Huge, unified energy systems, but each transmission grids are making way to better and more imaginative ways to create and transmit energy (solar panels & smart grid)

Convergence of Net-Generation Technology Creates New Reality

Even though the digital revolution is speeding good fit, many of the other cutting-edge technologies are gaining traction at a certain time.

Artificial intelligence is extracting useful information from massive amounts of data collected by linked gadgets.

Through a virtual depiction of real-world systems, digital twins can enable real-time data analysis and infrastructure monitoring.

Industries are trying to diversify their businesses.

Industries are branching out into new fields in order to meet changing Industries needs and develop new income streams. This includes the development of distributed energy resources and smart grid, as well as joint venture with technology giants.

Smart City Approaches will be at the forefront.

Energy and utility firms will play a bigger role in building smart, sustainable livelihoods that are well-connected and prepared to manage disasters.

To gain power and influence skill platforms are being established.

The industry is becoming more appealing to the socially conscious digital native as it places a greater emphasis on renewable energy and the use of next-generation technology.

Challenges & Opportunities.

Grid infrastructure failures, information security concerns, energy storage problems, data management concerns, communication challenges, stability concerns, and energy management concerns Economic and social challenges.

From generating to customer relationship management, there are possibilities all throughout the power-industry value chain. Many utilities have released mobile apps for bill notification, analysis, quality of service, billing, and outage management.

Conclusion

There seems to be little or no need for external methodologies for any system to be successful and efficient. Digital optimization will always benefit the business by 25-30 percent.

In the future, why will smart meters be needed?

Electrical theft is a big issue in the energy industry, as it harms electric power suppliers and results in financial loss. Detecting and preventing electrical theft is a difficult undertaking that requires consideration of a variety of factors, including economic, social, regional, managerial, political, infrastructure, literacy rate, and so on.

Smart power meter deployments via modern metering infrastructure offer intriguing solutions and even more potential, as they give sufficient data for analytical inferences and pre-emptive cyber-attack mitigation.

The first step in preventing energy thefts, according to this study, is to identify the sources of hazards. It provides a framework for monitoring, recognising, and mitigating threats in a smart utility network based on factors suggestive of electricity thefts. The proposed framework focuses primarily on the symptoms of the identified dangers that are indicative of potential electricity theft.

The losses in power systems network are mainly categorised into technical losses, comprising the power dissipated in power systems’ components (e.g., transmission and distribution lines, transformers, protective devices etc.) and non-technical losses, which are losses that cannot be traced back to any technological components. technical losses occur naturally and are often calculated based on the systems’ components and network parameters while electricity thefts form the major lump of the non-technical losses. As a result, energy thefts and non-technical losses are frequently used interchangeably.

This may be addressed by providing real-time monitoring of power use and billing data for the purposes of analysing usage trends and detecting anomalies in order to ensure energy efficiency.

AMI provides a comprehensive picture of how to address the many security issues that lead to electricity theft. Future research could go deeper into each of the highlighted anomalies, as well as the use of appropriate intelligent algorithms to test data in order to build the framework for real-time decision assistance.

+91-7300973009